SIMPLE STEPS DEBUGGING MEMORY.DMP USING DEBUGGING TOOLS FOR WINDOWS
- Obtain and install the debugging tools. The links do change over time, but the
following link is currently an exhaustive page which includes Windows Server
2012 and Windows 8 Consumer debugger tools, Windows 7, Vista, XP and Windows
Server 2003.http://msdn.microsoft.com/en-us/windows/hardware/hh852365
- All you need to install is the “Install Debugging Tools
for Windows as a Standalone Component (from Windows SDK)” and during the
install only select "Debugging Tools for Windows". Everything else is used for more advanced
troubleshooting or development, and isn’t needed here. Today I followed the link to “Install
Debugging Tools for Windows as a Standalone Component (from Windows SDK)”
although for a different OS you may need to follow a different link. Please
follow steps below.
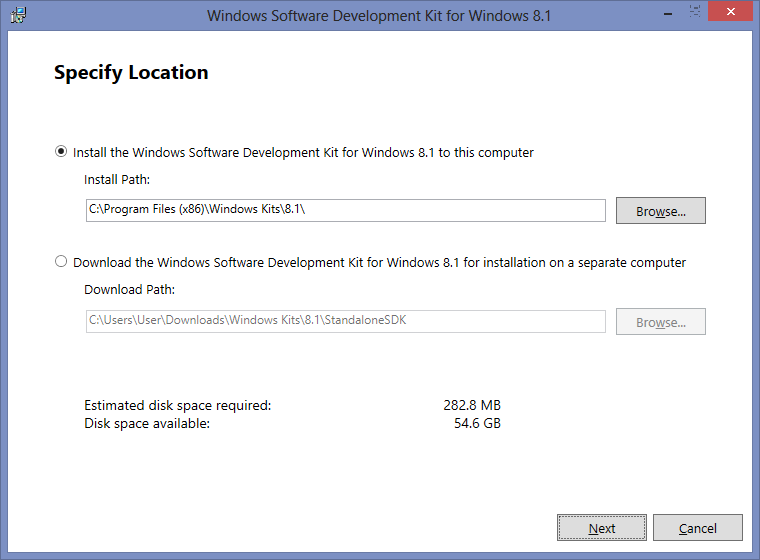
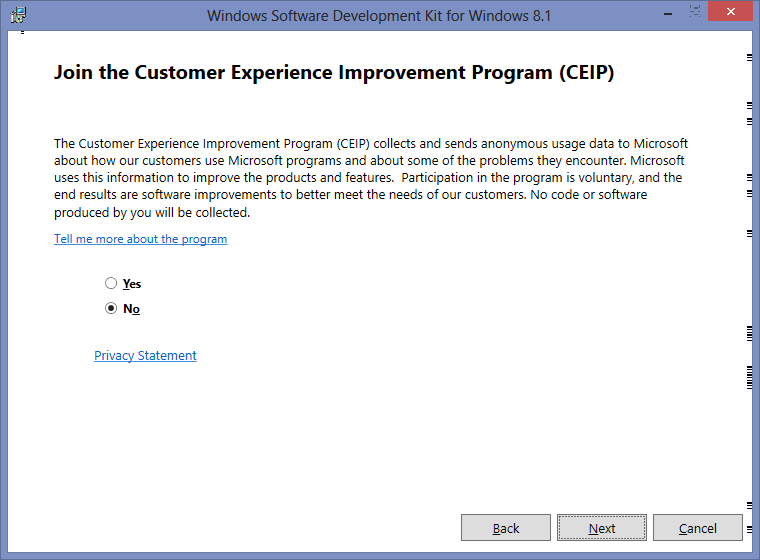
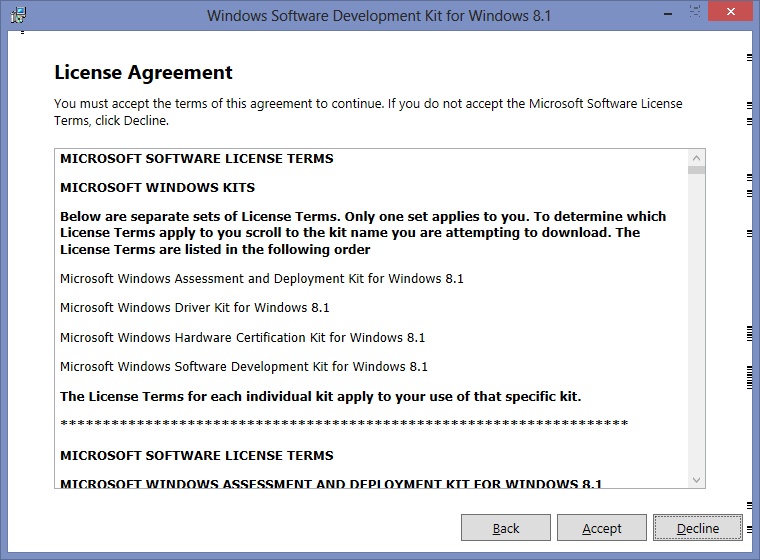
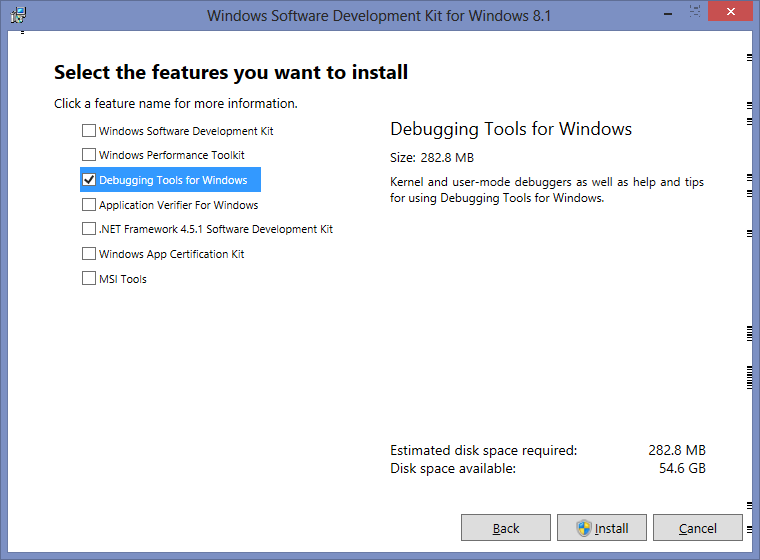
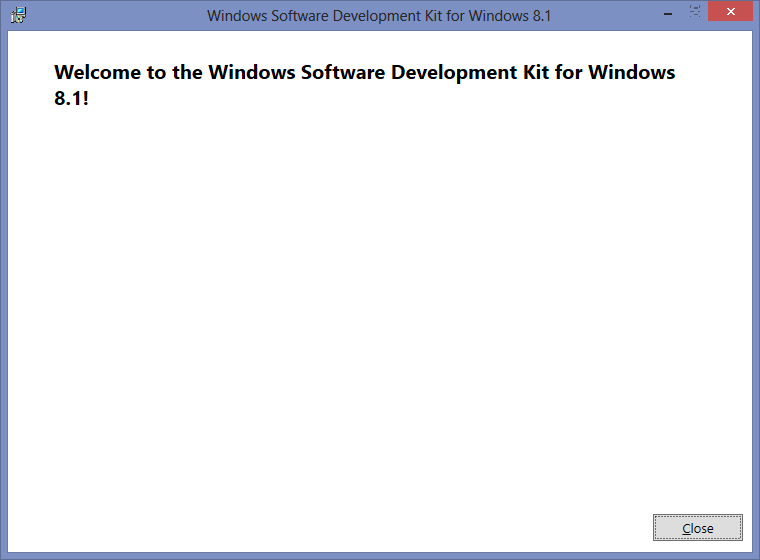
- From an elevated command prompt navigate to the debugging folder. For me with the latest tools on Windows Server 2012 it was at C:\Program Files (x86)\Windows Kits\8.0\Debuggers\x64\. You can specify the path during the install.
- Save memory.dmp same location with path C:\Program Files (x86)\Windows Kits\8.1\Debuggers\x64
- At cmd type kd -z MEMORY.DMP
- At cmd type .logopen c:\debuglog.txt
- At cmd type .sympath srv*c:\symbols*http://msdl.microsoft.com/download/symbols
- At cmd type .reload;!analyze -v;r;kv;lmnt;.logclose;q
- Wait until log successfully generated as shown below;
- Review the results by opening c:\debuglog.txt in your favourite text editor. For example using trace32, as you can see VTrack.sys was triggered bugcheck and cause the server unexpected shutdown.


Thanks to MFS for awesome steps.
ReplyDelete